
Y-Charts
A Y chart is an ideal strategy to involve learners in in-depth thinking on any situation. It encourages students to move from concrete descriptions to abstract descriptors.
Before beginning any group work in the classroom a Y chart could be developed on effective group work; thus setting the scene for the expectations of cooperation and teamwork whilst working in groups.
The real value of the Y chart lies in providing a rich tapestry of adjectival responses on which a better product/design idea can be made. Very useful when exploring and defining a task.
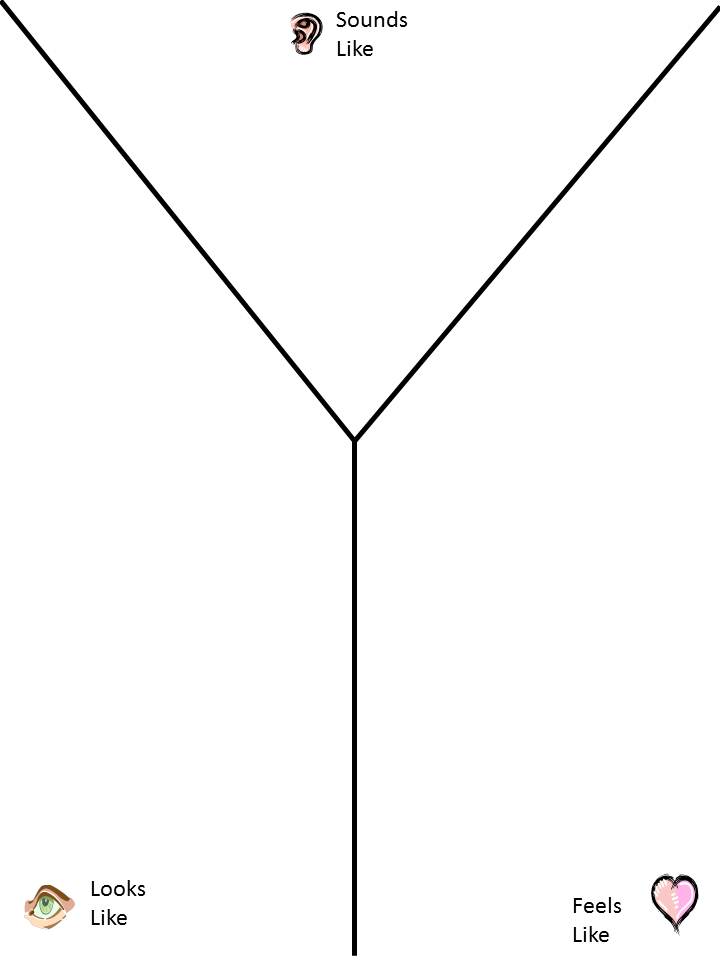
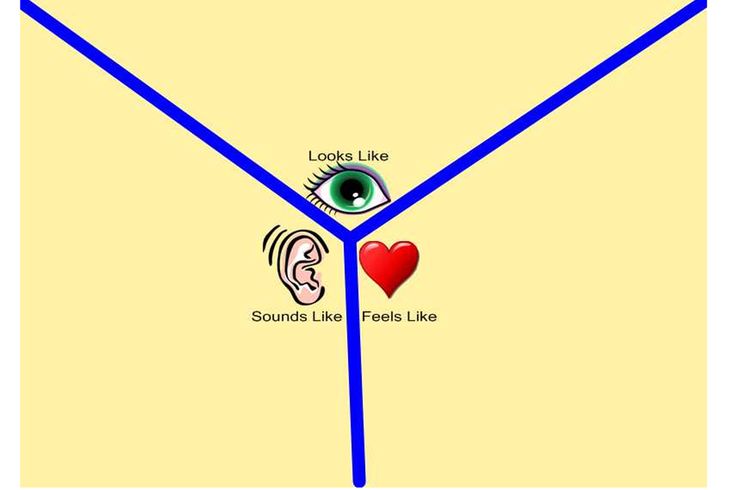
A Y-Chart is split into three sections:
Looks like - obvious aspects, as well as implied
Feels like - tactile, as well as emotional, spiritual feelings
Sounds like - encourages students to think of the type of conversations that may be heard, as well as the obvious sounds heard.
The process for creating a Y-chart:
Before beginning any group work in the classroom a Y chart could be developed on effective group work; thus setting the scene for the expectations of cooperation and teamwork whilst working in groups.
The real value of the Y chart lies in providing a rich tapestry of adjectival responses on which a better product/design idea can be made. Very useful when exploring and defining a task.
A Y-Chart is split into three sections:
Looks like - obvious aspects, as well as implied
Feels like - tactile, as well as emotional, spiritual feelings
Sounds like - encourages students to think of the type of conversations that may be heard, as well as the obvious sounds heard.
The process for creating a Y-chart:
- Decide on the topic to be analysed/research
- Draw up a simple Y-Chart and write the topic at the top of the page
- Label each section (Looks like/Feels like/Sounds like)
- In the 'looks like ' section, students will brainstorm everything that they might see happening around the site of the topic
- In the 'sounds like' section, students record things that they may hear, such as words, sounds and sound affects
- In the 'feels like' section, students brainstorm all the things they may feel, both physically (tactile) and emotionally
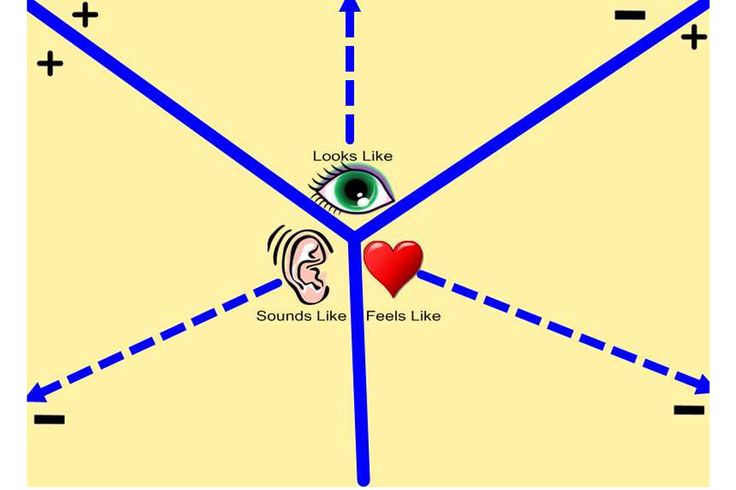
Different forms of Y-Charts:
| y-chart.jpg |
| y-chart_circle.png |
| y-chart_with_animations.jpg |
| y-chart_with_animations +-.jpg |
